


Do you know how much power, paper and toner your printers use? Is your staff wasting paper? Are you paying too much for your printers? Are you going through toner too fast? Do you print in color when black and white would work?
Getting the answers to these questions is not easy. Even if you have a Managed Print Service, your account rep might show up once a year (or even less often) and give you a bunch of statistics, but no answers. The Gordon Flesch Company is here to change that.
Did you know the average employee’s printing costs average around $600 to $1,300 every year? And according to StopWaste.org, up to 17% of everything that’s printed is actually waste. What’s more, 15% of all paper documents that aren’t waste end up misplaced and 7.5% are lost completely.
GFC helps address these challenges by connecting all your printing devices to a single monitoring system. This ensures each of your devices receives maintenance when needed. But even more importantly, we can now provide your business with a monitoring system that enables you to identify and track levels of printing and adjust your printer fleet to your exact needs.
Microsoft Power BI is a suite of business analytics tools that let you analyze data and share insights. By using Power BI tools, you can explore data and quickly create rich reports and dashboards. You and your colleagues can then use the reports interactively on many devices.
GFC can now provide on-demand data to our customers to review fleet status, service performance and recommendations for improvement. Building on Microsoft’s Power BI analytics platform, GFC is the first office technology company to be able to offer live, data-driven analytics to our customers. Microsoft Power BI merges different data sources, creates visualizations and uncovers trends and useful statistics.
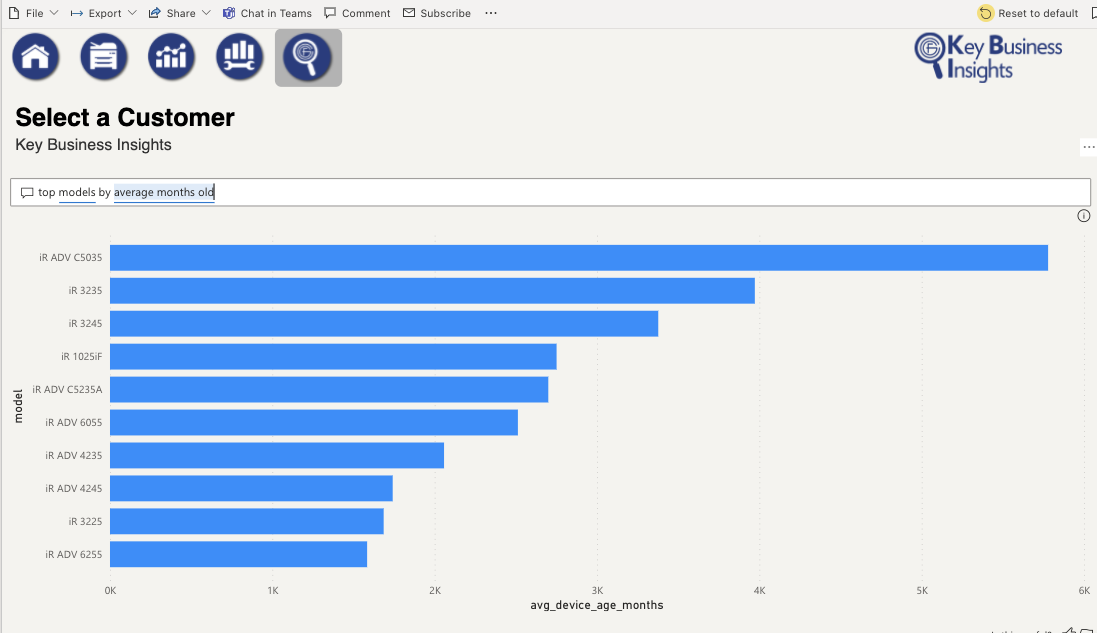
Examples of the information provided in our Strategic Business Review (SBR) reporting include: Usage Trends, Volumes by Device, Volumes by Location, Device Availability, Service Calls & Resolution, Value of Service Agreements, Action Items, etc.
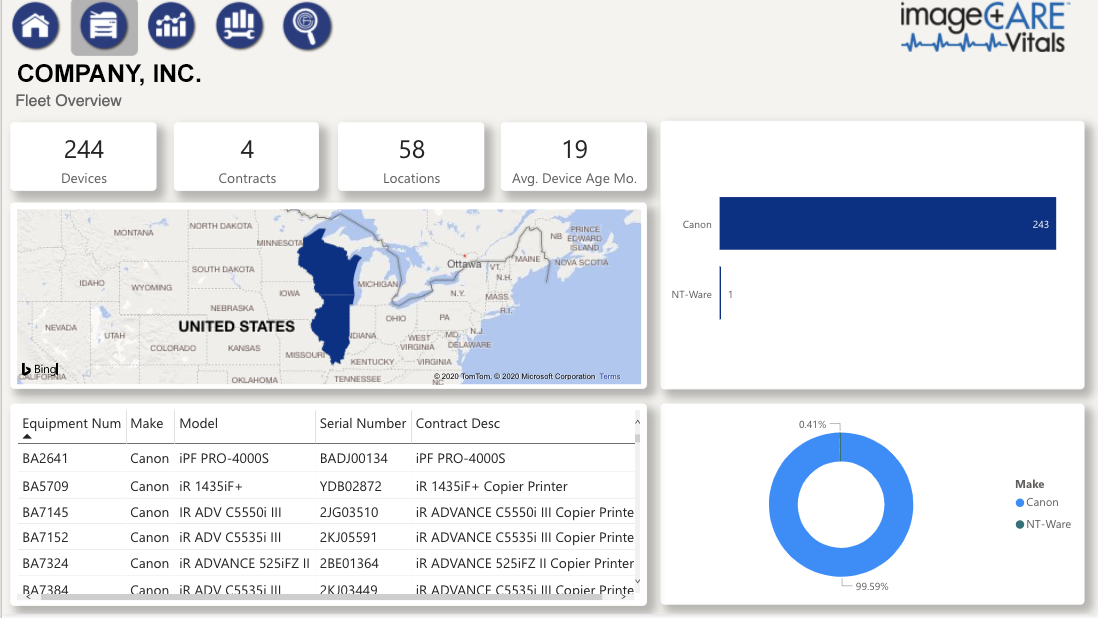
As you can see above, we can provide you a real-time look at all of the devices in your organization.
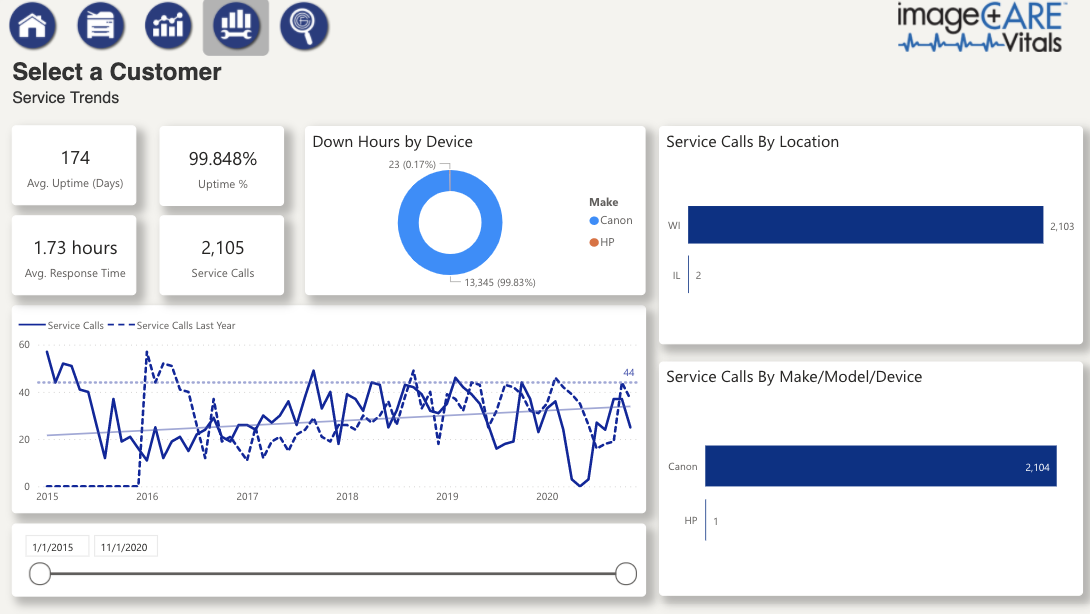
In addition, our dashboards can show you exactly how well you machines are running and show you all service data you may want to review.
Your data dashboard will provide real-time data, uptime statistics and usage trends so that you can drill down and see a complete fleet overview that will help you deploy and upgrade your technology as appropriate. As your technology partner, we believe it is essential to meet face-to-face with you to discuss your strategic, operational and business needs so that we can continue to deliver clear insights and recommendations to help you succeed.
GFC can now offer data visualization and insights to help make sure that all parties are on the same page and moving your organization ahead. This is the most accurate, current data, and you will be able to see exactly how well your print technology is performing and how to make your service more cost-effective.
If you are interested in a Managed Print Service and would like to get more insights and information about your printer fleet, contact us today for a free, no-obligation Managed Print Needs Assessment!